Make sense of your survey exports
Use this toolkit to turn a Qualtrics response file into organized tables and an interactive report. Start with a CSV you already have, or download responses through the Qualtrics API.
You can follow the guides by copying a few commands. You do not need to write Python. If someone has already sent you a report, start with reading a report.
Create your first report Parse a CSV again
Choose your next step
-
Try it with example data
Install the toolkit, use a small practice survey, and open your first report.
-
Work with your own export
Parse a CSV or ZIP, add a survey definition, and choose where to save the result.
-
Understand the results
Learn why you get ten tables and why one response can produce several answer rows.
-
Prepare a dashboard
Export six tables for Power BI and connect them with the right relationships.
From export to report
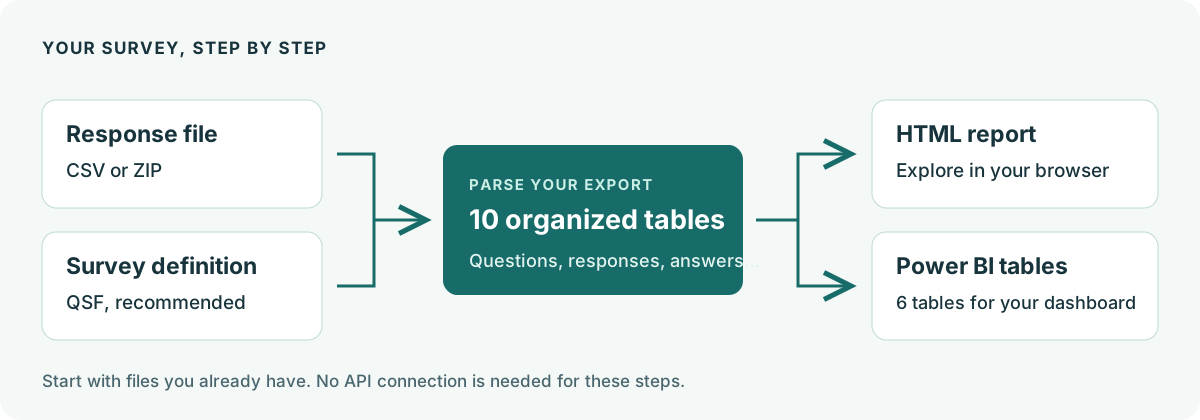
Keep the response file and its matching survey definition together. The response file contains people's answers; the definition describes the questions and allowed choices. After parsing, you can create a report, combine surveys, or prepare a dashboard.
The example survey uses invented responses. You can complete the first-report tutorial without a Qualtrics account or API token.
Find a specific answer
| I want to… | Go to |
|---|---|
| Set up the toolkit on my computer | Installation |
| Read or share a report | Reports |
| Bring several surveys together | Combine surveys |
| Download responses from Qualtrics | API access |
| Look up a command or option | CLI reference |
| Use the toolkit from Python | Python reference |
| Fix an error | Troubleshooting |
This is the documentation for the Qualtrics Python toolkit. For your organization's Qualtrics account, survey editor, or permissions, use your organization's support channel or the official Qualtrics help.